FIR Filter Simulation in Python
Advertisement
This document explains a Python script that simulates an FIR (Finite Impulse Response) filter, specifically a low-pass type. We’ll explore the code, the underlying FIR filter equation, and the resulting output plots.
An FIR filter determines its current output sample value using only current and past input digital samples. Crucially, it doesn’t rely on past output samples.

The simple FIR equation is shown below:
FIR Filter Python Code
Here’s the Python code used to generate the FIR filter simulation:
import matplotlib.pyplot as plt
import scipy.signal as sig
import numpy as np
from math import pi

plt.close('all')

# Filter parameters
N = 20          # Filter order
fc = 100        # Cutoff frequency (Hz)
Fs = 1000       # Sampling frequency (Hz)

# Normalize the cutoff frequency
w_c = 2 * fc / Fs

# Design the FIR filter using the window method
t = sig.firwin(N, w_c)

# Compute the frequency response
[w, h] = sig.freqz(t, worN = 2000)

# Convert frequency to Hz
w = Fs * w / (2 * pi)

# Convert magnitude to dB
h_db = 20 * np.log10(abs(h))

# Plot the frequency response
plt.figure()
plt.plot(w, h_db)
plt.title('FIR filter response')
plt.xlabel('Frequency (Hz)')
plt.ylabel('Magnitude (dB)')
plt.show()
This script utilizes the scipy.signal library for filter design and frequency response calculation, numpy for numerical operations, and matplotlib for plotting. The firwin function designs the FIR filter using the window method.
FIR Python Output Plots
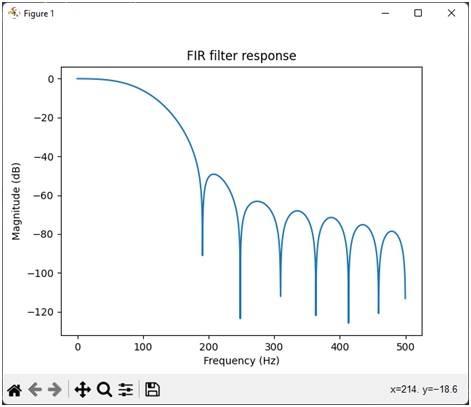
The following image shows the output plots generated by the FIR python code. The plot shows the frequency response of the low pass FIR filter.

Advertisement
 RF
RF


