Rician Channel Model Simulation in MATLAB
Advertisement
This article explains the Rician Channel model, providing MATLAB simulation parameters and a code script for implementation. Rician channel model plots are also presented. This model simulates both Line-of-Sight (LOS) and Non-Line-of-Sight (NLOS) components between the transmitter and receiver.
MATLAB offers a built-in function called ricianchan to simplify Rician channel modeling. The details and accompanying MATLAB code are described below.
This channel model is crucial for simulating real-time fading phenomena observed in wireless communication systems.
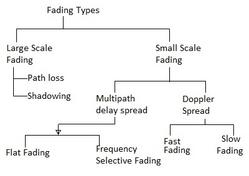
Refer to comprehensive articles on fading basics and fading types for a deeper understanding.
The MATLAB function ricianchan has the following syntax:
chl_res = ricianchan(Ts, Fd, K, Tau, PdB);
Where:
Ts: Input signal sampling time (in seconds).Fd: Maximum Doppler shift (in Hz).Tau: Path delay vector (in seconds).K: A vector of the same size asTau, representing the K-factor. This is the ratio of power in the direct (LOS) path to the diffuse (NLOS) power, expressed as a linear scale (not in dB).PdB: Path gain vector (in dB).chl_res: The channel coefficients returned by the MATLAB functionricianchan. This result is similar to what would be returned by therayleighchanfunction (for Rayleigh fading).
Rician MATLAB Code
The following MATLAB script demonstrates the implementation of the Rician channel model:
% 3-path Rician Matlab code
clc;
clear all;
close all;

load file_ldacstxpkt; % Load baseband IQ vector (Tx_Packet)
Tx_Packet = Tx_Packet.';

KFactor = 3;       % Rician K-factor
Ts = 1e-4;        % Sampling time in seconds
Fd = 100;         % Doppler frequency in Hz
Tau = [0 1.5e-4 2.5e-4]; % Delay for the three paths
PdB = [0, -2, -6];      % Power in each of the three paths

pkt_allones = ones(1,480) + 1i*ones(1,480); % Create a vector of all ones for testing

% Rician channel model
h = ricianchan(Ts, Fd, KFactor, Tau, PdB);
h.StoreHistory = true;

Rx_pkt_allones = filter(h, pkt_allones);
Rx_Packet = filter(h, Tx_Packet); % Pass the baseband IQ vector through the Rician channel

% Plots
figure; plot(h); % Plot the channel impulse response
figure; plot(abs(Tx_Packet)); title('Baseband IQ packet without Rician channel');
figure; plot(abs(Rx_Packet)); title('Baseband IQ packet with Rician channel');
figure; plot(abs(Rx_pkt_allones)); title('Baseband IQ of all ones after passing through Rician channel');
Rician Channel Model Plots
The following plots illustrate the Rician channel impulse response, the baseband IQ vector without the channel, the baseband IQ vector after passing through the Rician channel, and the channel response to a baseband IQ vector consisting of all ones.

Rician Channel Impulse Response

Baseband IQ Vector without Channel

Baseband IQ Vector with Rician Channel

Channel Response with All Ones Baseband Vector with Rician
Advertisement
 RF
RF

