IMD Measurement: Advantages and Disadvantages
Advertisement
This article discusses the Intermodulation Distortion (IMD) measurement method, a key technique for assessing amplifier linearity. It covers the benefits and drawbacks of using IMD measurements.
What is IMD Measurement?
When an amplifier is fed with two signals of equal amplitude, it generates harmonics and other frequency components related to the input frequencies. This means that in addition to the original two input signals (F1 and F2), you’ll observe other frequency components, known as intermodulation products.

Figure-1: IMD measurement setup
The most significant intermodulation products are often those closest to the desired frequencies (f1, f2), specifically 2f1-f2 and 2f2-f1, as they can interfere with the intended signal.

Figure-2: IMD products
Understanding the Third Order Intercept (TOI) Point
The Third Order Intercept (TOI) point is a crucial parameter in IMD analysis. It represents the theoretical point where, for every 1 dB increase in input power, the third-order intermodulation products increase by 3 dB. This results in a slope of 3 when plotted on a graph. The TOI point arises from the third-order IMD products, such as 2w1-w2 and 2w2-w1, as illustrated in the frequency spectrum.
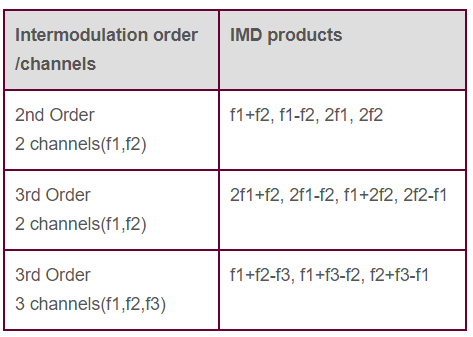
The following table shows the resulting third-order intermodulation output frequencies when two input frequency channels (f1 and f2) are applied.

Table-1: IMD products
The graph below illustrates various points, including P1dB at both input and output, as well as the TOI points at the input (IIP3) and output (OIP3).

Figure-3: IMD curve with slope 3
Advantages of IMD Measurement
Here are the benefits of using IMD measurement for assessing amplifier linearity:
- Simplicity: The method only requires two tones for measurement, making the setup and analysis relatively straightforward.
- Accessibility: The necessary test and measurement equipment, such as signal generators and spectrum analyzers/VNAs (Vector Network Analyzers), are commonly available in RF testing labs.
- IP3 Determination: It’s easy to determine the IP3 (Third-Order Intercept Point) value from the IMD curve, where the amplitude of the third-order products is plotted.
- Linearity Indication: The rate at which the third-order products increase relative to the desired signal (ideally, three times the rate) provides a direct indication of amplifier linearity. A higher IP3 value signifies lower IMD and better amplifier linearity.
Disadvantages of IMD Measurement
Despite its advantages, the IMD measurement method has limitations:
- Equipment Cost: It requires two signal generators and a spectrum analyzer or VNA, which can be expensive.
- Simplified Signal: While convenient, using only two tones doesn’t accurately represent the complex, multi-tone signals that amplifiers often encounter in real-world applications.
- Limited Dynamic Loading Representation: Two CW (Continuous Wave) tones fail to replicate the dynamic loading that an amplifier experiences during normal operation.
- Power Supply and Thermal Effects: Power supply and thermal effects can differ significantly between two-tone testing and multi-tone or real-world signal scenarios.
- Phase Sensitivity: Measurements can vary depending on the relative phase relationship between the tones; random phase relationships yield different results compared to phase-coherent tones.
- Complexity with Advanced Modulation: The measurement becomes complex for signals using advanced modulation schemes like OFDM (Orthogonal Frequency-Division Multiplexing), which are commonly used in LTE and 5G physical layers.
Advertisement
 RF
RF


