 RF
RFAmplifier Linearity Measurement: IMD, NPR, and Crest Factor
Advertisement
This page discusses Power Amplifier Linearity Measurement Methods, covering techniques like IMD (intermodulation distortion) measurement, NPR (noise power ratio) measurement, and CF (Crest Factor) measurement (or peak-to-average power ratio measurement).
Introduction
GaN technology is rapidly advancing, with wideband RF Power Amplifiers (PAs) being the most popular GaN devices used in 5G networks. 5G systems demand very stringent linearity. Traditional methods are often insufficient to accurately predict real-world amplifier linearity. The following methods offer simpler, more accurate, and less error-prone alternatives to traditional tools.
Amplifiers are characterized by various parameters, including gain, bandwidth or frequency response, power output, linearity, efficiency, and noise figure.
Amplifier Linearity Measurement Method-1 | IMD Measurement
Linearity: This is determined by measuring the output power with a uniform increase in input power until the amplifier enters the compression region.
One key parameter is P1dB, which indicates the point where the output power no longer follows the input power linearly. In other words, a 1 dB change in input power results in less than a 1 dB change in output power.

Figure-1: P1dB and IP3 curve
The measurement setup for IMD measurement is shown in the block diagram below. It consists of two signal generators whose outputs are combined using an RF power combiner and fed to the Device Under Test (DUT). The output is measured using an RF Spectrum Analyzer.

Figure-2: IMD measurement setup
Besides the desired outputs (at F1 and F2), the setup generates other products, which are harmonics or IMD products of the two input signals (F1 and F2). The major consequences arise from 2f1-f2 and 2f2-f1 as they are near to desired frequencies(f1,f2) in the frequency spectrum.

Figure-3: IMD products
Let’s understand the Third Order Intercept (TOI) Point. This is the point where each 1dB increase in input power results in a 3dB increase in output power. Hence, a slope of 3 is achieved. The third-order intercept point is the result of third-order IMD products, such as 2w1-w2 and 2w2-w1, as shown in the frequency spectrum.
The table below lists the third-order intermodulation output frequencies resulting from the application of two input frequency channels (f1 and f2).
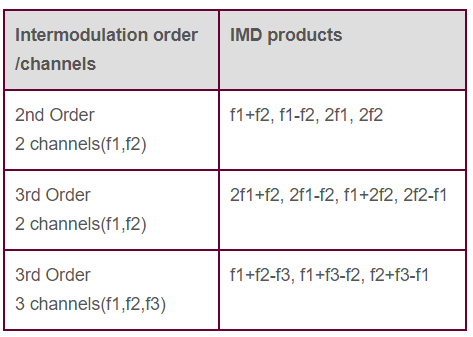
Table-1: IMD products
The graph below shows various points, including P1dB at the input and output, and TOI points at the input (IIP3) and output (OIP3). Each 1dB increase in P1dB results in a 3dB increase in 3rd order IM (Intermodulation) power. The TOI point is a figure of merit that characterizes an RF receiver’s tolerance to multiple RF signals outside the passband of interest. The TOI points on the X-axis and Y-axis are designated as IIP3 and OIP3, respectively.
Refer to IIP3 versus OIP3 for a description of the difference between IIP3 and OIP3.
Amplifier Linearity Measurement Method-2 | NPR Measurement

Image Courtesy: Microwave Journal
The figure above depicts a test setup for NPR (noise power ratio) measurement. In this method, an AWGN generator produces white noise. The noise is bandlimited by a filter before being fed to the DUT (Amplifier). The filter used is a notch filter with a notch greater than 50 dB below the passband amplitude and a width of approximately 1% or less than the filtered noise BW.
The amplitude of the applied noise signal is increased to the point of nonlinearity. As discussed earlier, IMD products result from the mixing of multiple tones when the amplifier is in the nonlinear region. As a noise signal consists of many tones, measuring individual IMD products is difficult. Therefore, the aggregate power of IMD products is measured at the notch frequency using a spectrum analyzer or VNA. As the products increase, the depth of the notch decreases.
This method can be expensive as it requires a high-quality filter with sufficient notch depth to observe the desired IMD products.
Amplifier Linearity Measurement Method-3 | Crest Factor Measurement

Image Courtesy: Microwave Journal
The Crest Factor (CF) is the ratio of peak to average power. The figure above shows the test setup for CF measurement. Similar to NPR measurement, this method also uses a band-limited noise signal as input to the amplifier. A directional coupler or power splitter couples the incident signal for measurement using a wideband power sensor. The video bandwidth (VBW) of the coupler/sensor should exceed the bandwidth of the noise signal for undistorted measurements.
The second measurement is taken at the output of the amplifier (DUT). An attenuator is used at the output of the DUT to keep the output within the measurement range of the sensor.
The CFs (Crest Factors) of the input and output are then compared. An output CF lower than the input CF indicates that the amplifier is in the compression region.
Using the input and output average power, one can determine the gain of the amplifier. However, gain changes with average power don’t provide an accurate measurement of the amplifier’s compression region. Hence, a CCDF curve is used to gain more insight into the amplifier’s performance. For each power level, the CCDF shows how much time the signal spends above the average power level, or in other words, the probability of the signal power being above the average power.
Advertisement


