 RF
RFPlotting 2D and 3D Curves in MATLAB
Advertisement
This page covers plotting functions for 2D and 3D curves in MATLAB, focusing on the plot and plot3 functions.
plot and plot3 MATLAB Code
Here’s an example demonstrating the plot and plot3 functions:
clc;
clear all;
close all;

x = [1 2 3 4 5 6 7 8 9 10];
y = [0.1 0.2 0.3 0.4 0.5 0.35 0.25 0.15 0.05 0.02];
z = [10 20 30 40 50 60 70 80 90 100];

figure;
plot(x, y);

figure;
plot3(x, y, z);
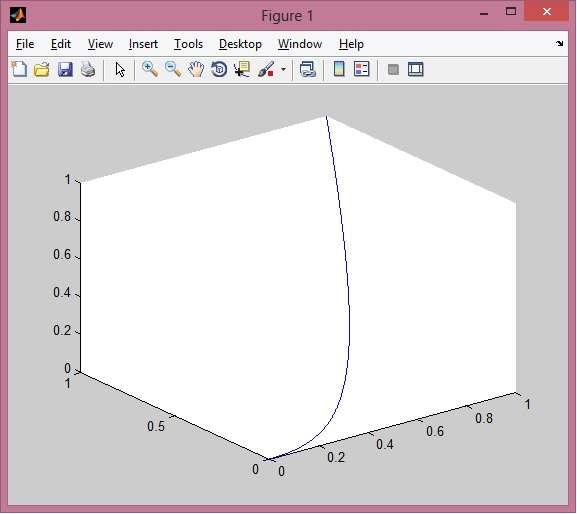
Another example using plot3:
clc;
clear all;
close all;

t = linspace(0, 1, 1000);
x = t;
y = t.^2;
z = t.^3;

plot3(x, y, z);
Output image:
stem3 Function
Another useful MATLAB function for plotting in 3D is stem3(x,y,z). This creates a 3D stem plot.
Advertisement


