IQ Data, Transmit Power, and Power Spectrum Analysis with LabVIEW
Advertisement
This document provides information about LabVIEW VIs (Virtual Instruments) for analyzing IQ data, transmit power, and power spectrum. You’ll find details on what these VIs do and how to use them. Download links for the LabVIEW source code files are also included.
This particular LabVIEW VI reads an IQ file, which contains real and imaginary values organized in two columns. It then generates the following plots:
- IQ Diagram: Visualizes the signal’s complex nature.
- Instantaneous Transmit Power: Shows the signal’s power over time.
- Power Spectrum: Displays the signal’s frequency content.
IQ vectors are commonly produced by wireless signal generators that use complex modulators. These signals are found in devices compliant with wireless standards like WLAN, WiMAX, and LTE.
For more in-depth information, refer to resources on IQ vector signal basics and signal generation and analysis.
Understanding the Plots
-
IQ Diagram: Plots the real component of the signal against the imaginary component.
-
Transmit Power: Displays the magnitude (absolute value) of the complex data vector over time (samples).
-
Power Spectrum: Calculated using the Fast Fourier Transform (FFT) of the time-domain data. This plot reveals the signal’s frequency components and their respective power levels.
Important Note: In practical applications, you’ll typically focus on the actual data values. DC components and guard carriers are often removed before generating the plots to improve clarity and focus on the relevant signal information.
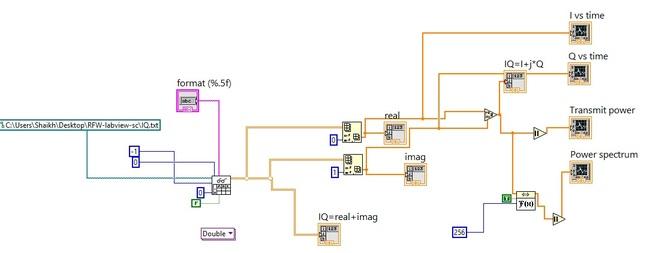
IQ, Power Plots LabVIEW VI Block Diagram
The following figure illustrates the block diagram of the IQ, power plots LabVIEW VI.

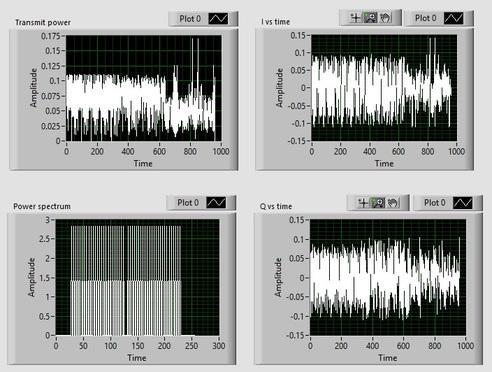
IQ, Power Plots LabVIEW VI Front Panel
The figure below shows the front panel of the IQ, power plots LabVIEW VI.

Download IQ, Power Spectrum, Transmit Power LabVIEW Source Code Files
Download Download IQ, power spectrum, transmit power labview VI source code files
Advertisement
 RF
RF


