 RF
RFOFDM Physical Layer Measurements: EVM, Power, CCDF, and Spectrum
Advertisement
Orthogonal Frequency Division Multiplexing (OFDM) is a widely used modulation technique in modern communication systems thanks to its spectral efficiency and resilience to interference. Accurate measurements at the physical layer are essential to ensure optimal performance and signal quality.
Key metrics like Error Vector Magnitude (EVM), Complementary Cumulative Distribution Function (CCDF), Power Spectrum analysis, channel frequency response (CFR), spectral flatness, and IQ Constellation measurements play a critical role in evaluating and optimizing OFDM signals. This page delves into each of these parameters, explaining their significance and how they are measured in wireless communication systems.
Power Spectrum Measurement
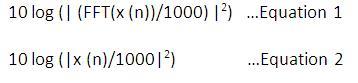
This is the Baseband transmitter power spectrum measured at the output of the IFFT module. The following equation is used to determine the value in dB. The X-axis represents frequency.
The spectrum shows the response of the power at various frequency bands. This helps in designing proper filters to meet RF compliance requirements as set by RF regulatory bodies.
Transmit Power
This is the instantaneous power at the output of the IFFT module in the baseband transmitter. Baseband transmit power assists power amplifier design by considering the PAPR characteristics of the modulated spectrum. This is mentioned in the equation below.
EVM per Subcarriers
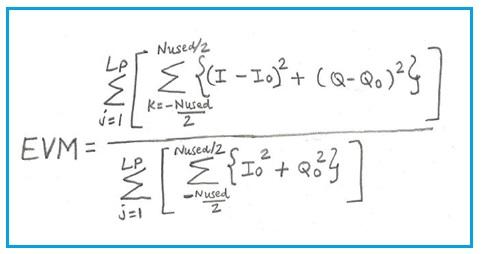
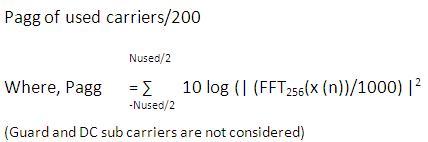
This measurement is usually calculated after taking the FFT in the de-mapper (before de-mapping). The generic equation is mentioned below. Here, 200 represents the total carriers (data + pilots) in one symbol. Likewise, EVM for all the symbols in LP packets and NF frames are calculated. For example, if an OFDM frame is 10 symbols long and each symbol has 192 data carriers, then EVM is plotted for all the subcarriers across all 10 symbols.
EVM per Symbols
This provides the individual symbol EVMs for each subcarrier, at each symbol, for all symbol times within the time domain frame.
For example, if an OFDM frame is 10 symbols long and each symbol has 192 data carriers, then the EVM per symbols measurement is plotted for all the symbols, and each symbol will have 192 EVM values for all the data carriers within the symbol.
This is also called DATA RCE (Relative constellation error). The same can be plotted for pilot carriers as well. This physical layer measurement is very useful to determine the performance of the modem.
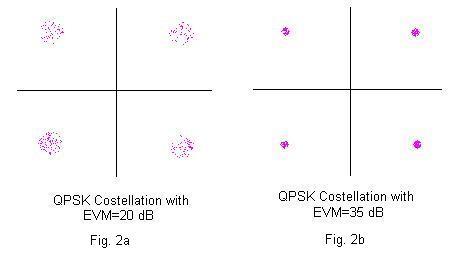
The figure depicts the effect of worst (EVM=20) and good (EVM=35) constellation as effect of EVMs.
CCDF
The CCDF, or complementary cumulative distribution function, is a statistical power calculation and can only be performed on time-domain data.
- Y axis: units of percent
- X axis: power in dB
Power on the x-axis is relative to the signal average power, so 0 dB is the average power of the signal. For example, 3 dB at 15 percent means there is a 15 percent probability that the signal power will be 3 dB or more above the average power. This physical layer measurement helps RF designers working on power amplifier design.
IQ Constellation Diagram
This measurement is carried out at the output of the IQ mapper as mentioned below for the X and Y axes.
- X axis: In-Phase component in volts represented as I (V)
- Y axis: Quadrature-Phase component in volts represented as Q (V)
Channel Frequency Response (CFR)
It is estimated after the frequency correction using the following formula:
H (f) = Y (f)/X (f) with simple linear interpolation
Where:
- H (f) is CFR
- Y (f) is the received preamble
- X (f) is the reference preamble
X axis is Carrier Index and Y axis is amplitude in dB.
Spectral Flatness
It is Calculated after channel estimation by taking FFT for Preamble symbol. Where x (n) is the received signal.
Where X axis is Carrier Index and Y axis is Power in dB. This physical layer measurement helps in understanding channel characteristics the transmitted signal has traversed from far end to reach the receiver end.
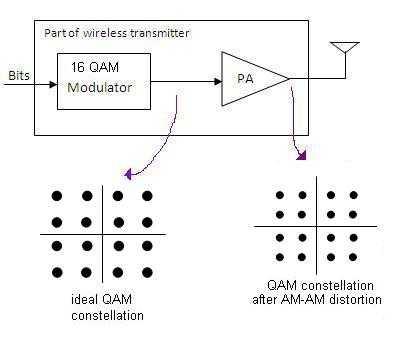
AM-AM Conversion
The measurement of AM to AM conversion refers to the relationship between the amplitude of the input signal and the amplitude of the output signal in a nonlinear system, such as a power amplifier. This metric is used to measure how well an amplifier preserves the amplitude information of the input signal.
In ideal amplifiers, the output amplitude is linearly proportional to the input amplitude. However, in real-world systems, especially at high power levels, nonlinearities cause distortions in this relationship. This results in compression or expansion of the signal amplitude, impacting signal fidelity and causing errors in communication systems.
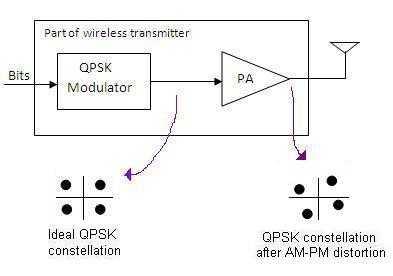
AM-PM Conversion
This AM to PM conversion measures the unintended phase shift in the output signal as a function of the input signal amplitude in a nonlinear system.
In ideal systems, the phase of the output signal should remain independent of the input amplitude. However, due to device imperfections, amplitude variations can introduce phase distortions. AM-PM conversion is critical in communication systems using phase modulation techniques, as it can degrade signal quality and increase bit error rates.
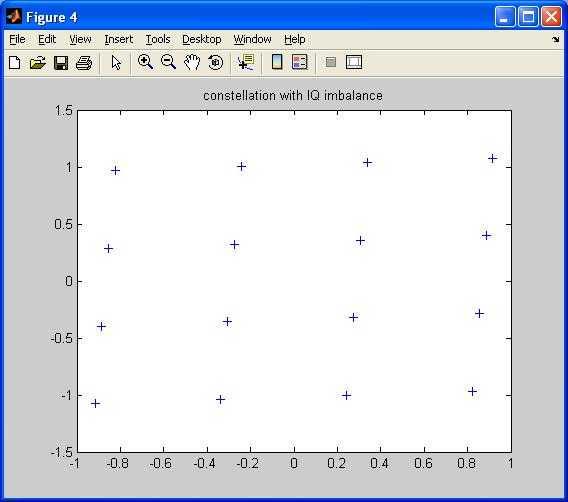
IQ Imbalance
IQ imbalance refers to the imperfections in the in-phase (I) and quadrature (Q) components of a signal in a quadrature modulator or demodulator, leading to amplitude and phase mismatches.
In ideal systems, the I and Q components are orthogonal, with equal amplitudes and a phase difference of 90 degrees. Imperfections in the modulator or demodulator can cause deviations, resulting in the following:
- Amplitude Imbalance: Unequal gain between I and Q channels.
- Phase Imbalance: Phase error deviating from 90 degrees.
These imbalances introduce distortions that degrade modulation accuracy, reduce spectral efficiency, and increase error rates. The effect of IQ imbalance on the constellation is shown in the following figure.
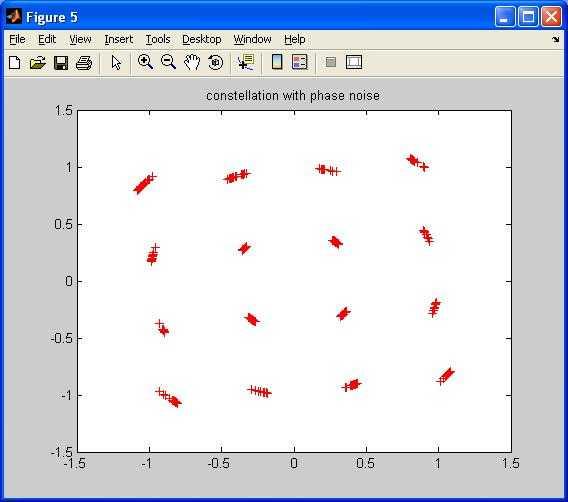
Phase Noise
Phase noise is the random fluctuation or jitter in the phase of a signal caused by imperfections in oscillators and frequency synthesizers.
Phase noise results from the instability of the signal source and manifests as sidebands around the carrier frequency in the frequency spectrum. It degrades the performance of communication systems by causing the following:
- Signal Interference: Overlapping with adjacent channels.
- Bit Error Rates: Introducing timing errors in high-speed communication.
- Error Vector Magnitude (EVM) Degradation: Impacting modulation accuracy.
Effective phase noise management is crucial for applications requiring high precision, such as radar systems, satellite communications, and 5G networks. The effect of phase noise on the constellation is shown in the following figure.
Conclusion
OFDM physical layer measurements, including EVM, Power, CCDF, Spectrum and IQ analysis, are indispensable tools for maintaining signal quality and optimizing system performance. These metrics provide insights into various aspects of signal integrity, enabling engineers to identify issues and implement improvements effectively. By understanding and utilizing these measurements, wireless systems can achieve better reliability, efficiency, and overall communication quality.
Advertisement


