 RF
RFRician Fading Channel Simulation in Python
Advertisement
This document provides a Python script to simulate Rician channel coefficients. We’ll cover the code, its outputs, and the underlying concepts.
Introduction:
Fading refers to the variations in received signal strength due to several factors between the transmitter and receiver, including their movements. These factors include path loss, multipath propagation, Doppler spread, shadowing effects, and mobility.
The Rician channel model simulates a channel with both Non-Line-of-Sight (NLOS) and Line-of-Sight (LOS) components between the transmitter and receiver.
Refer to articles on fading basics and fading types for more background information.
Rician Channel Python Code
Here’s the Python script used to generate Rician channel coefficients:
#  This python script is used to generate rician channel coefficients
import math
import matplotlib.pyplot as plt
import numpy as np
from numpy.random import standard_normal

# Sinusoidal waveform generation
t = np.linspace(1, 100, 750)
x_volts = 20*np.sin(t/(2*np.pi))
x_watts = x_volts ** 2
x_db = 10 * np.log10(x_watts)

#  Rician channel coefficients
N = 1000  # Number of samples to generate
K_dB = 10 # K factor in dB
K = 10**(K_dB/10) # K factor in linear scale
mu = math.sqrt(K/(2*(K+1))) # mean
sigma = math.sqrt(1/(2*(K+1))) # sigma

h = (sigma*standard_normal(N)+mu)+1j*(sigma*standard_normal(N)+mu)
h_mag = np.abs(h)
h_mag_dB = 10*np.log10(h_mag)  # convert channel response in dB

# Convolve rician channel response with sinusoidal waveform
Y4 = np.convolve(h, x_volts)

# Plots
figure, axis = plt.subplots(2, 2)
axis[0, 0].plot(x_volts)
axis[0, 0].set_title("Pure sine wave signal")
axis[0, 1].plot(h)
axis[0, 1].set_title("Rician Channel response")
axis[1, 0].plot(h_mag_dB)
axis[1, 0].set_title("Rician Channel response in dB")
axis[1, 1].plot(Y4)
axis[1, 1].set_title("Convolved sine wave signal")
plt.tight_layout()
plt.show()
Code Explanation:
-
Imports: The code imports necessary libraries like
math,matplotlib.pyplotfor plotting,numpyfor numerical operations, andnumpy.randomfor generating random numbers. -
Sinusoidal Waveform Generation: This section creates a simple sine wave, which will be passed through our simulated Rician channel.
t = np.linspace(1, 100, 750): Creates an array of 750 evenly spaced points between 1 and 100, representing time.x_volts = 20*np.sin(t/(2*np.pi)): Generates the sine wave with an amplitude of 20.x_watts = x_volts ** 2: Converts the voltage signal to power.x_db = 10 * np.log10(x_watts): Converts the power signal to dB.
-
Rician Channel Coefficient Generation: This is the core of the simulation.
N = 1000: Sets the number of samples to generate for the channel.K_dB = 10: Defines the K-factor (Rician factor) in dB. The K-factor is the ratio of the power of the LOS component to the power of the scattered components. A higher K-factor indicates a stronger LOS component.K = 10**(K_dB/10): Converts the K-factor from dB to a linear scale.mu = math.sqrt(K/(2*(K+1))): Calculates the mean () of the Gaussian random variables used to generate the Rician fading.sigma = math.sqrt(1/(2*(K+1))): Calculates the standard deviation () of the Gaussian random variables.h = (sigma*standard_normal(N)+mu)+1j*(sigma*standard_normal(N)+mu): Generates the complex Rician fading coefficients. It creates two sets of Gaussian random variables (one for the real part and one for the imaginary part), each with mean and standard deviation , and combines them to form a complex number.h_mag = np.abs(h): Calculates the magnitude of the complex Rician fading coefficients.h_mag_dB = 10*np.log10(h_mag): Converts the magnitude of the channel response to dB.
-
Convolution: The code then convolves the generated Rician channel response with the sinusoidal waveform.
Y4 = np.convolve(h, x_volts): Convolves the Rician channelhwith the sine wavex_volts. Convolution in this context simulates the effect of the channel on the transmitted signal.
-
Plotting: Finally, the code generates plots to visualize the results.
figure, axis = plt.subplots(2, 2): Creates a figure with a 2x2 grid of subplots.axis[0, 0].plot(x_volts): Plots the original sine wave.axis[0, 1].plot(h): Plots the Rician channel response (complex values).axis[1, 0].plot(h_mag_dB): Plots the magnitude of the Rician channel response in dB.axis[1, 1].plot(Y4): Plots the convolved signal (sine wave after passing through the Rician channel).plt.tight_layout(): Adjusts the subplot parameters to provide reasonable spacing between plots.plt.show(): Displays the plots.
Rician Fading Channel Output Plots
The following plots illustrate the output of the Rician fading channel Python code:
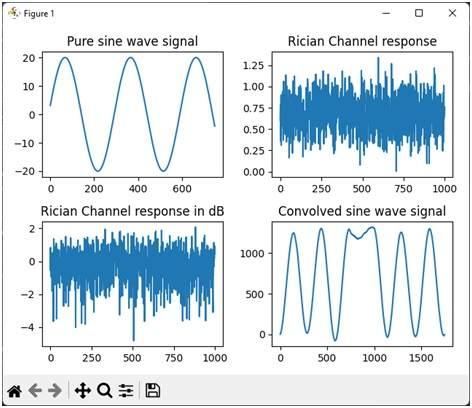
Plot Descriptions:
- Pure Sine Wave Signal: Shows the original sine wave signal before passing through the channel.
- Rician Channel Response: Shows the complex Rician channel coefficients.
- Rician Channel Response in dB: Shows the magnitude of the channel response in dB, visualizing the fading characteristics.
- Convolved Sine Wave Signal: Shows the sine wave after being convolved with the Rician channel, demonstrating the effects of fading on the signal.
Advertisement


